
Reproductive rights and population data
Human rights mean each person has agency over family decisions. Population data helps us understand demographic change, from long-term trends to the choices governments make about services and planning. Explore the estimates, projections and uncertainty behind the figures.
World population in 2026
In World Population Prospects 2024, the United Nations projects a world population of about 8.30 billion for 1 July 2026.
This is a medium-variant projection, not a live headcount. Projections use demographic data and assumptions about future change, and may be revised as new evidence becomes available. Read how population projections differ.
Source: UN DESA Population Division, World Population Prospects 2024, demographic indicators (Excel, 26 MB), World, total population as of 1 July, medium variant. Source checked 30 September 2026.
How we got here
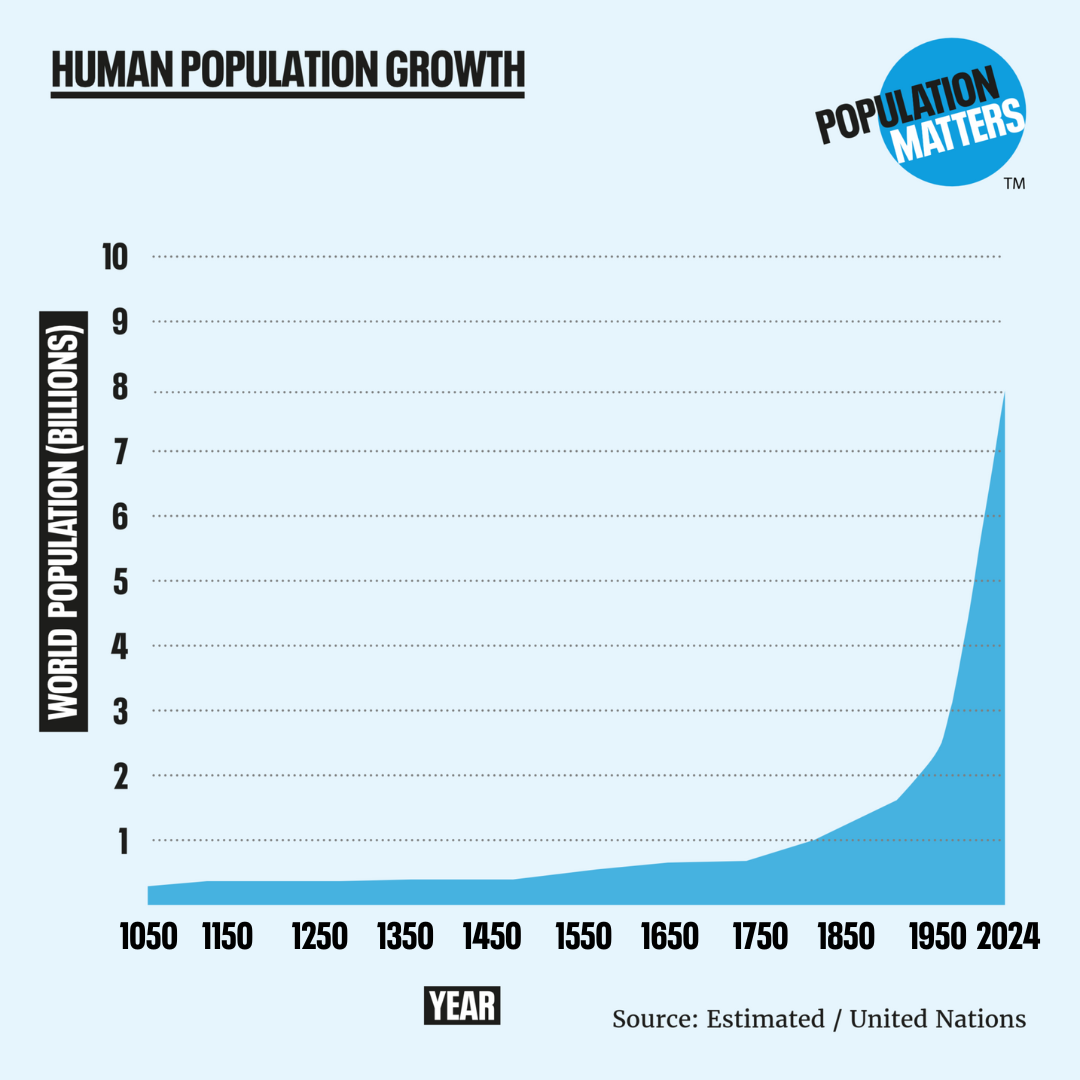
| Year | World population (billions) |
|---|---|
| 1950 | 2.49 |
| 1970 | 3.69 |
| 2000 | 6.17 |
| 2023 | 8.09 |
These selected years cover the modern part of the graph. Figures are rounded to two decimal places. They are UN estimates, not complete global census counts. In the 2024 revision, annual estimates run through 2023 and projections start in 2024.
Source: UN DESA Population Division, World Population Prospects 2024, demographic indicators (Excel, 26 MB), World, total population as of 1 July, Estimates worksheet.
Until the time of Napoleon, there were less than 1 billion people on Earth at any one time. Since the Second World War, we have been adding a billion people to the global population every 12-15 years. Our population is more than double today what it was in 1970.
Where we could be going next
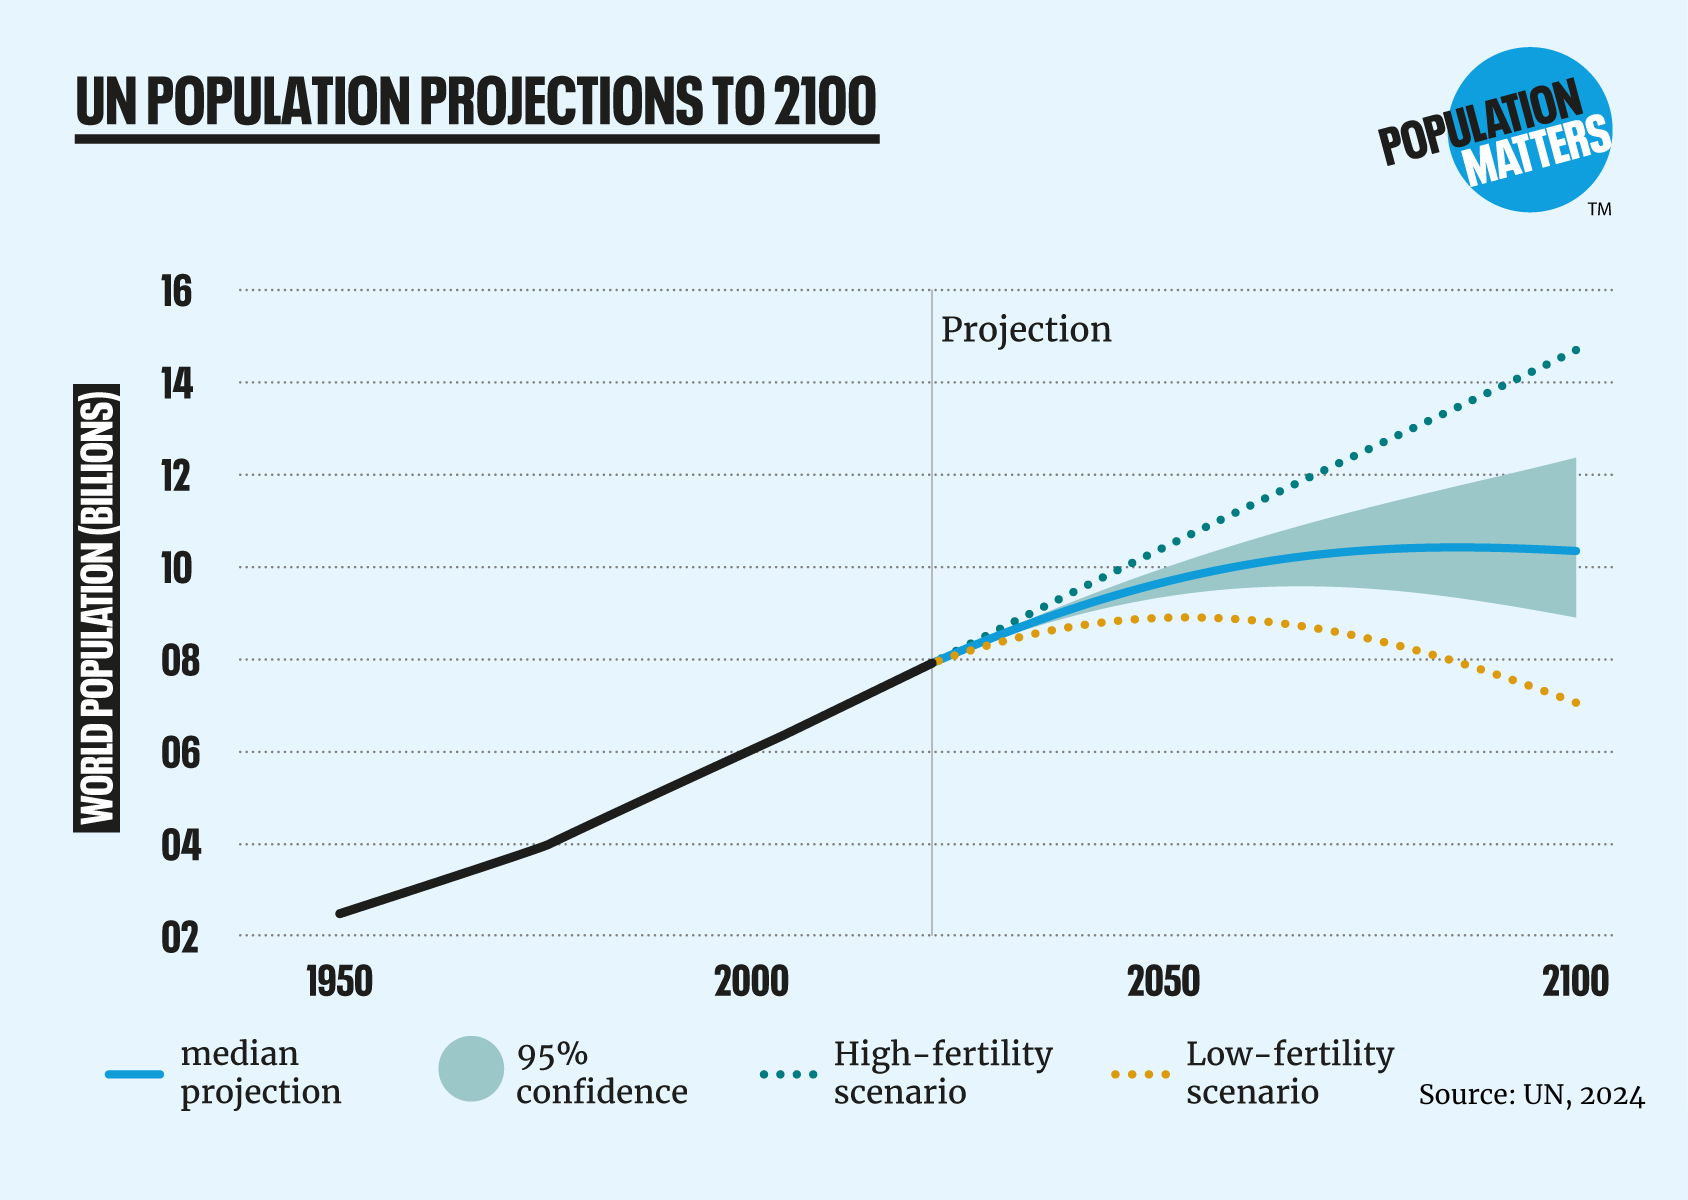
Every two years, the United Nations makes projections for future population growth. Its latest medium projection – the most likely scenario – is a population 10.3bn in the 2080s, two billion more than today. Because many factors affect population growth, it makes a range of projections depending on different assumptions. Within its 95% certainty range, the difference in population in 2100 from the highest to lowest projection is 3.5 billion people – almost half the population we have today.
Read our explainer on why population projections differ, and our dated analysis of the UN 2024 projections.
The dotted lines on the graph above shows the UN’s projected population if, on average, every other family had one fewer child or one more child than in the median projection (‘low fertility and “high fertility” scenarios).
Explore population growth and its effects on our planet
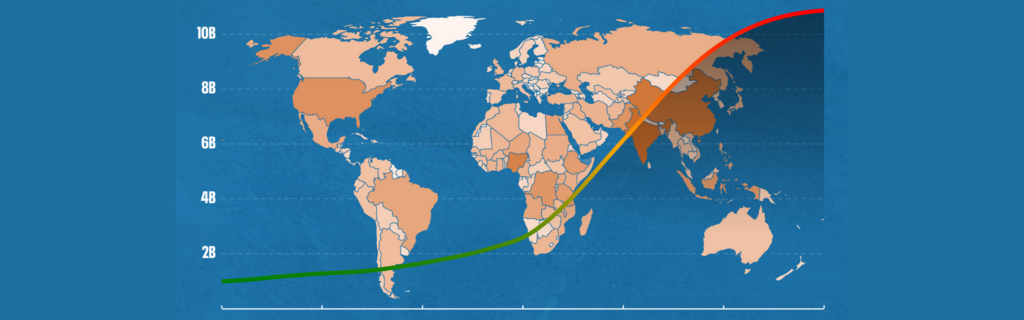
Our Population Explorer is an interactive online tool providing insights onto population growth and its impacts on nature, climate change and our demand for the Earth’s resources. You can investigate different areas, explore solutions and interact with the graphics to find out more. Check it out!
Act Now for Nature
Soil, insects and the ecosystems we depend on are in crisis. For a limited time, matched funding means your gift can go twice as far for urgent research, advocacy and rights-based solutions.

Where population growth will occur
- Eight countries will make up over half the projected total population increase by 2050: India, Nigeria, the Democratic Republic of the Congo, Pakistan, Ethiopia, Tanzania, Egypt, and Indonesia.
- As expected, India overtook China as the world’s most populous country in 2023, and China’s population has started to decline.
- In 63 countries and areas, containing 28 per cent of the world’s population in 2024, the size of their population peaked before 2024.
- In 48 countries and areas, representing 10 per cent of the world’s population in 2024, population size is projected to peak between 2025 and 2054.
(Source: UN DESA Population Division, 2024)
The impacts of rapid population growth and its causes continue to pose a major impediment to achieving the Sustainable Development Goals, in particular eradicating hunger and poverty, achieving gender equality, and improving health and education. Poverty is also a significant driver and predictor of population growth. Total population in the UN’s designated Least Developed Countries is projected to rise from just over 1bn in 2020 to 1.76bn in 2050.

More than half of the people added to the world’s population over the rest of the century will be in sub-Saharan Africa. Although it is falling, fertility rate (the average number of children per woman) remains high in most African countries (see ‘Bringing Down Fertility’ below for why). Due to its high fertility rate, sub-Saharan Africa has a very young population: 60% of the population is less than 25 years old. That means that many people are entering their childbearing years. Thanks to improvements in access to health care, life expectancy is increasing and child mortality is declining, meaning there are now more generations alive at the same time.
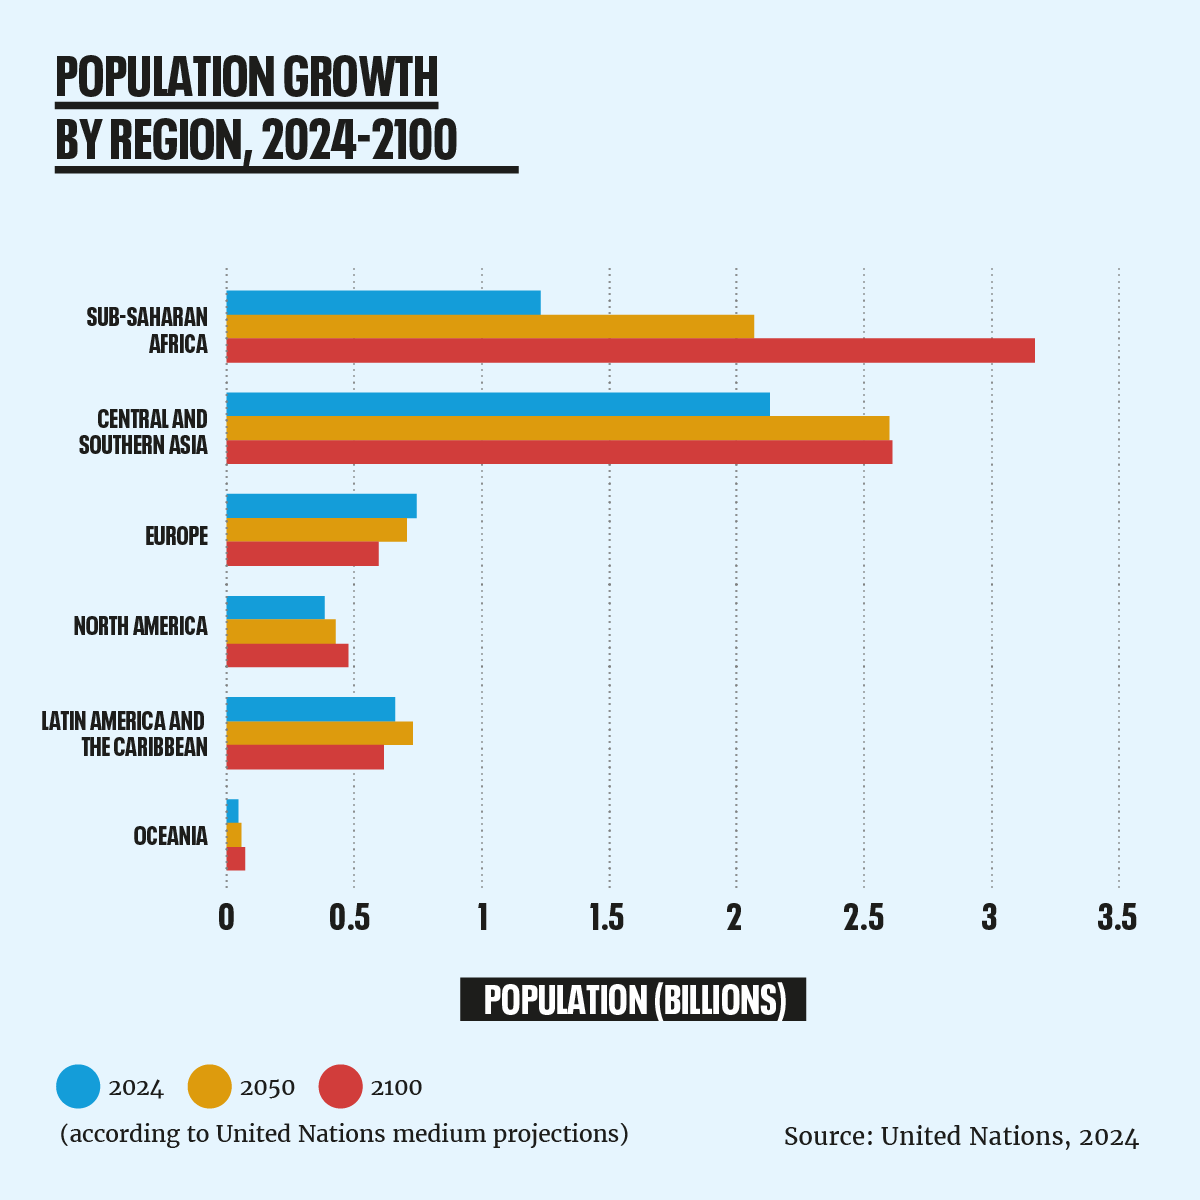
These figures regarding populations of different continents and countries include assumptions about future migration, but are necessarily very speculative. Climate change, poverty and population pressures themselves will lead to a highly mobile global population, with Africa likely to be the largest source of emigrants.
Unequal impact
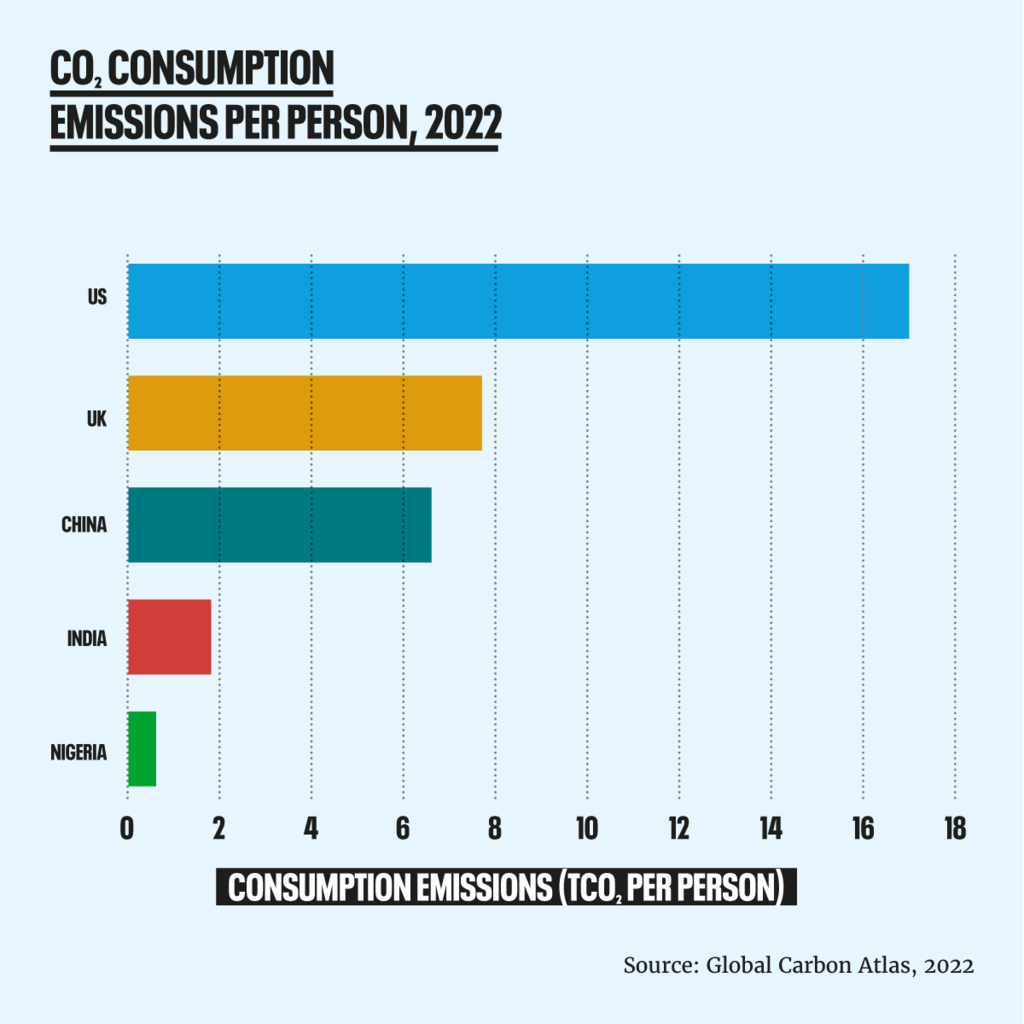
It is important to remember when looking at all these figures that while population growth is highest in the Global South, and relatively low in most parts of the Global North, consumption, resource use and carbon emissions are far greater in the richest parts of the world. That means that the global environmental impact of each individual in wealthy countries is far higher than in poor countries. To truly achieve a more sustainable world for people and the planet, we must also work to address overconsumption.
Fertility rates and population
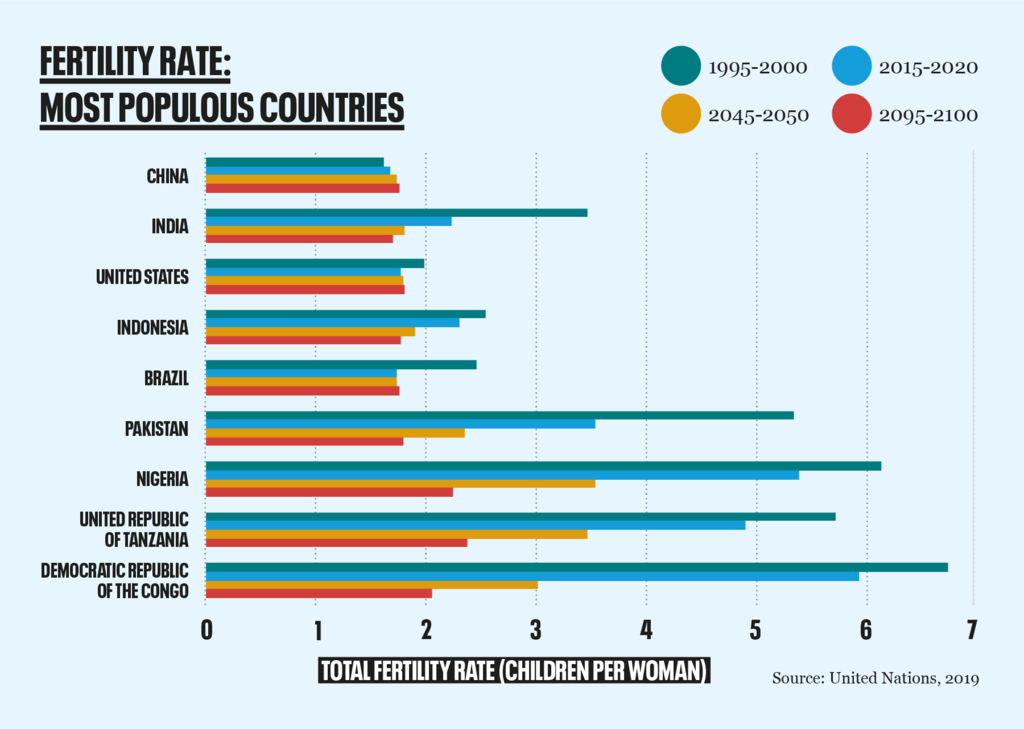
Period total fertility rate (TFR) summarises a year’s age-specific live-birth rates. It describes the births a hypothetical woman would have if those rates applied throughout her reproductive life and she survived that period; it is not a prediction of one woman’s eventual family size.
Replacement-level fertility means each generation replaces itself without migration, accounting for mortality before reproductive ages. Around 2.1 births per woman is a common approximation when mortality is very low; it is not a universal threshold or a guarantee of stable population size. Age structure, mortality and migration also affect population change.
- The medium scenario in World Population Prospects 2024 projects a global TFR of 2.25 live births per woman for 2024.
- The same scenario projects a TFR of 4.26 live births per woman for sub-Saharan Africa in 2024.
- The UN’s 2024 summary reports that, at that time, two-thirds of the global population lived in a country or area with TFR below 2.1 live births per woman.
- In the 2024 medium scenario, global TFR is projected to be about 2.10 live births per woman in 2050. Country rates vary; a projection depends on assumptions and is not a demographic target.
Sources: UN DESA Population Division, World Population Prospects 2024 demographic indicators (Excel, 26 MB), 2024 Summary of Results and 2024 methodology report. The 2024 and 2050 TFR values come from the Medium variant projections worksheet in the 2024 revision; they are not new 2026 observations.
Populations are also affected by death rates, net migration and the proportion of people of childbearing age. Populations of countries with fertility rates below replacement level often continue to experience natural increases (births minus deaths) for some time. In particular, where birth rates have recently been high, when the babies born in that period reach childbearing age they increase the number of families, even though the size of their families is smaller than in the previous generation. This is called ‘demographic momentum’ and means that the impact of changes in fertility normally takes many decades to be reflected in population.
The effect of migration
Many countries with less than replacement rate are also growing due to net migration. When immigration is greater than emigration, this increases numbers of people directly but it can also increase the birth rate. This is usually because migrants tend to be younger people of working age, so are more likely to have children than the average for the existing population, and because in some cases, they come from countries or cultures with traditionally higher fertility rates and family sizes.
In other countries, net migration is outward, meaning their populations are decreasing, or growing at a smaller rate than they otherwise would. When the people leaving are of reproductive age (which is usually the case), emigration causes the fertility rate to fall even further. In some cases, these countries also have low fertility rates already (such as Bulgaria and Romania).
(You can find out more about the meanings of the technical terms used on this page in our Glossary.)
Empower women
Fertility rates decrease rapidly when women are empowered, when children (especially girls) stay in education for longer, when countries become more affluent, and, crucially, when people can use modern contraception.
More than 200 million women in developing countries currently have an unmet need for family planning, meaning they do not want to get pregnant but are not using moden contraceptive methods. Research published by the Guttmacher Institute shows that this is often because they are unable to access family planning but more commonly because of concerns about side effects and misinformation, and, in nearly a quarter of cases, because their male partners or others close to them oppose contraceptive use. Contraception provision must be accompanied by education, support and female emancipation to be effective.
Another important factor in uptake of contraception is desired family size. Religious, cultural and social influences all play a part in that, as do economic and political factors. Where people cannot rely on the state to support them, they tend to have larger families to ensure they have children who can support them. Where child mortality is still high, people also tend to have more children. The “value” of women and girls may also be judged by the number of children they have (not just in places where women are not empowered) and traditions valuing larger families are often internalised.
Effective family planning programmes, such as that in Thailand, have helped individuals exercise their reproductive rights to realise their desired family size.
Test your knowledge on population

How much do you know about our population, how it’s changing, its impacts and solutions? Take our quiz to find out.